How to Use the Dashboard in Ostana
Last updated: June 11, 2025
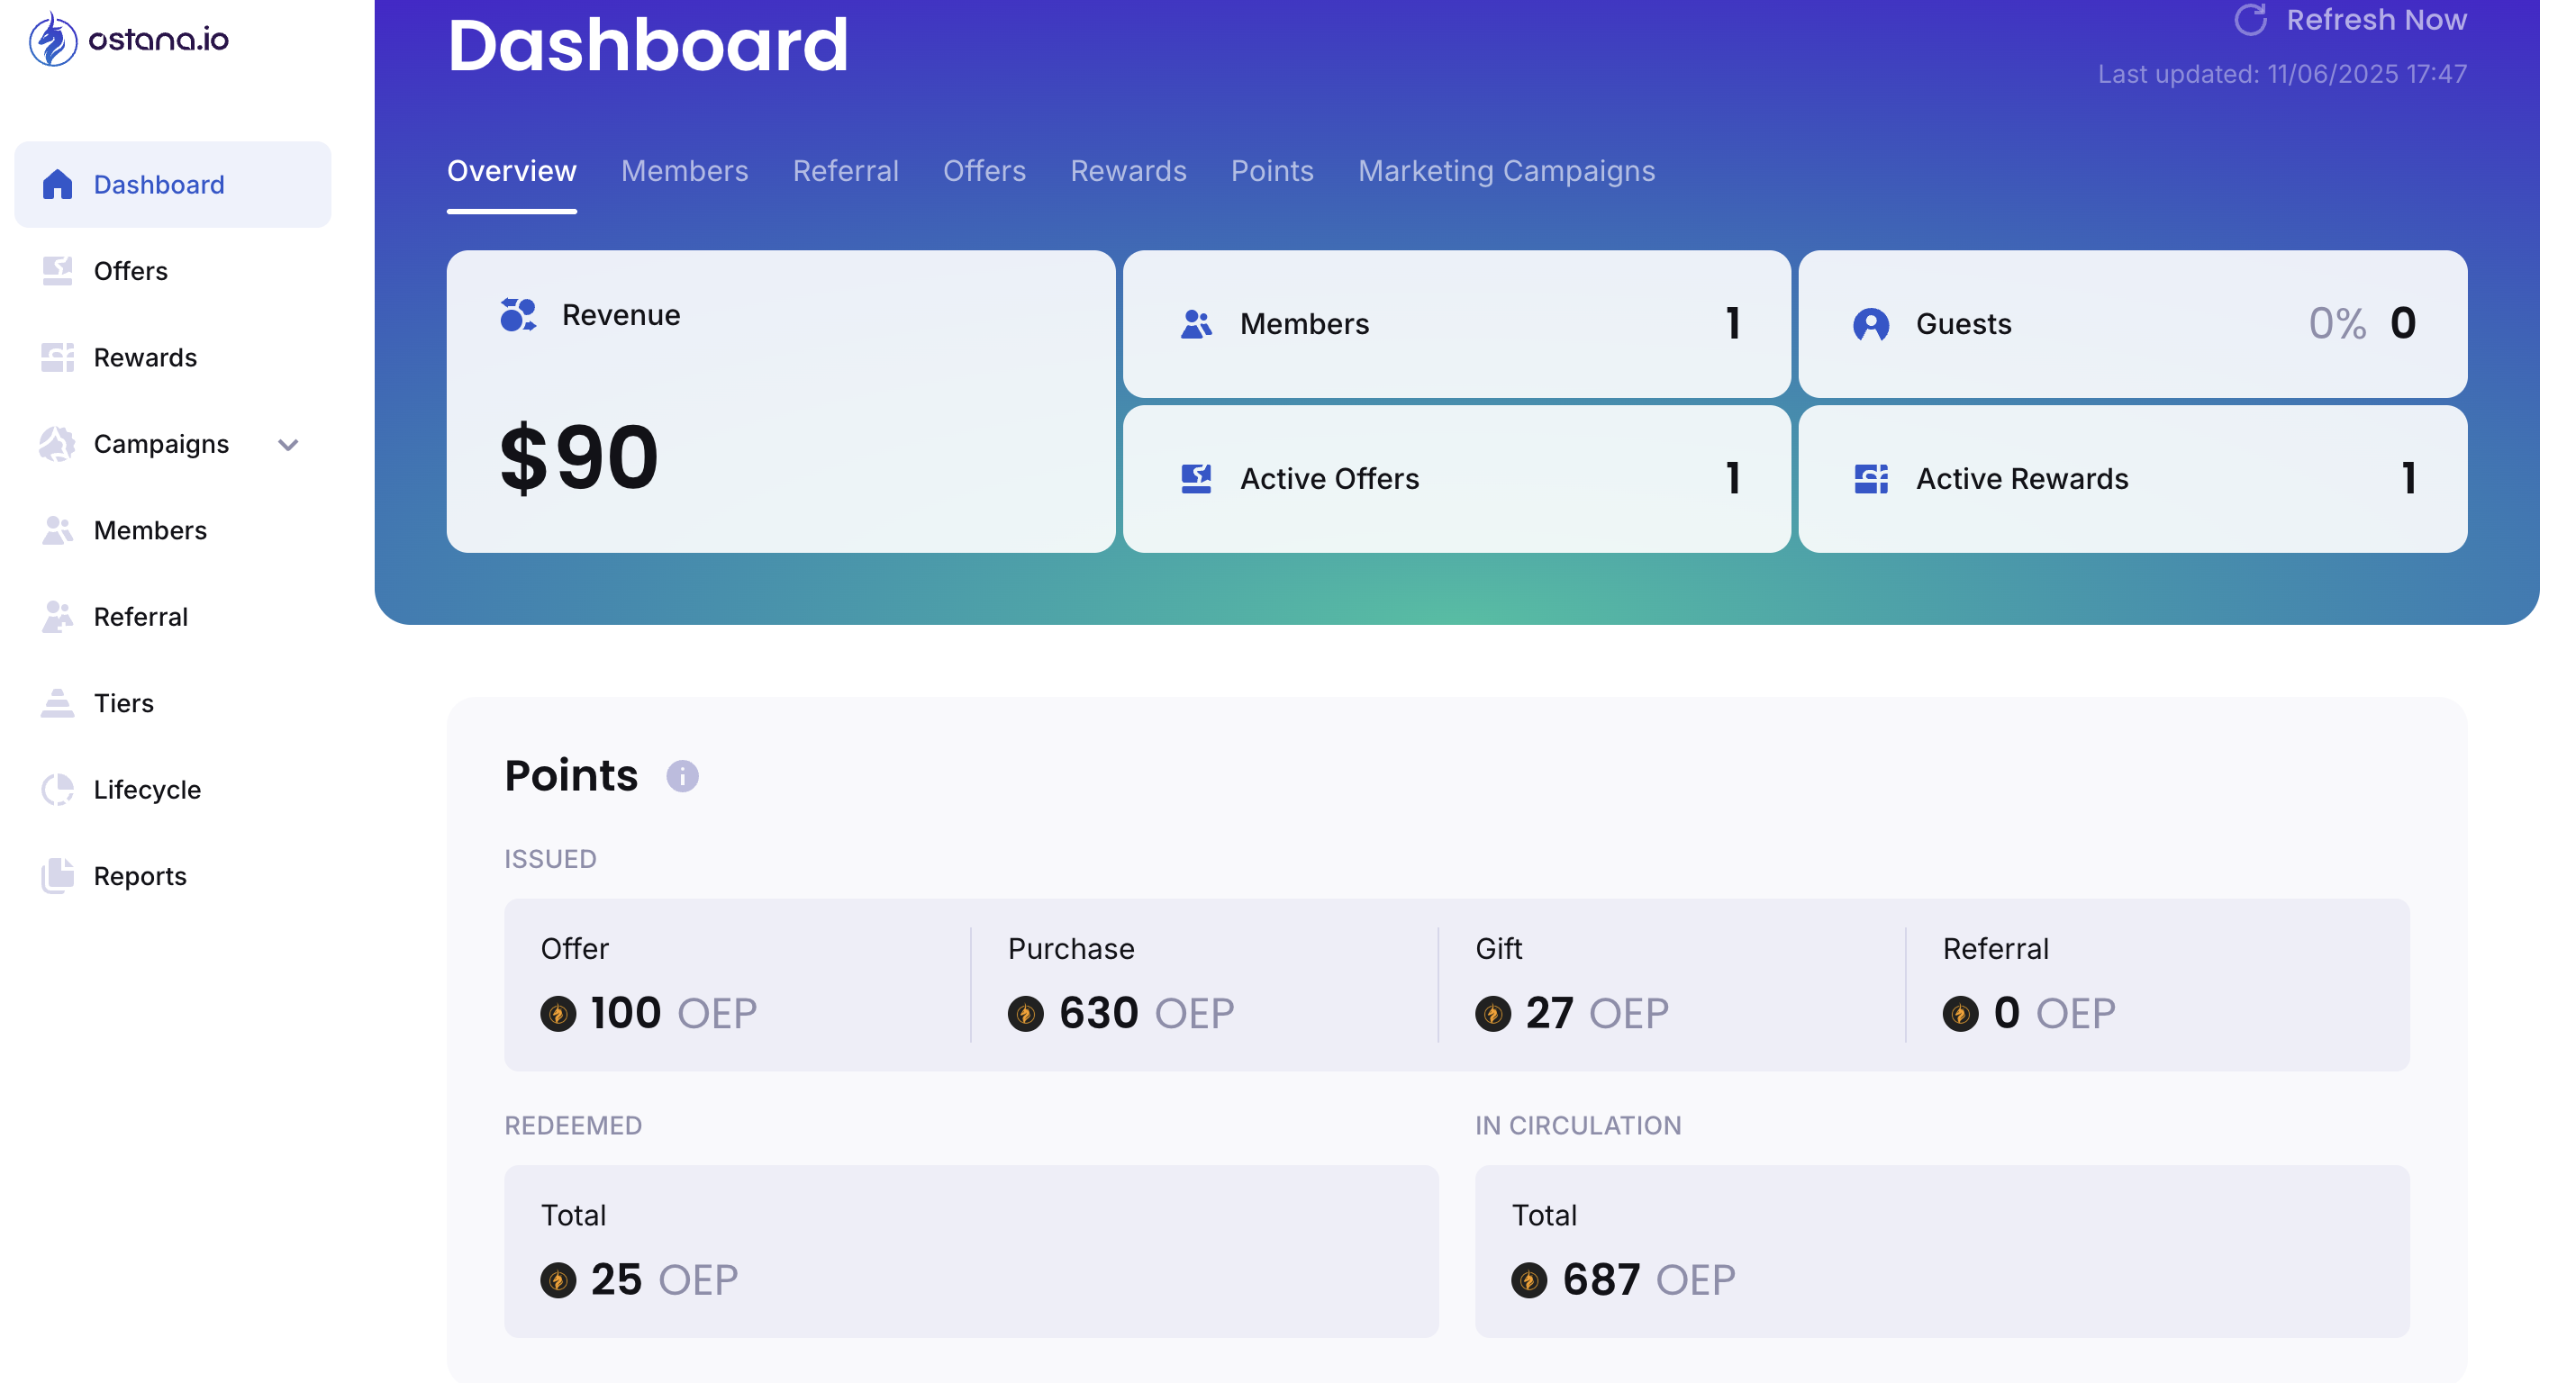
Ostana’s Dashboard is your central hub for tracking loyalty program performance across members, referrals, offers, rewards, points, and campaigns. It gives real-time insight into what’s working and what needs your attention—at a glance.
🧭 Navigation Overview
You can toggle between the following tabs along the top of the dashboard:
Overview
Members
Referral
Offers
Rewards
Points
Marketing Campaigns
Each tab updates in real time and can be filtered by date (day, week, month, or custom range).
🔍 Overview Tab
Gives a quick snapshot of overall activity:
Revenue: Tracked through loyalty-related actions
Members vs Guests: See your total loyalty signups
Active Offers & Rewards: Monitor how many offers and rewards are currently live
Points Panel:
Issued points: via purchases, offers, gifts, referrals
Redeemed points: total claimed
In Circulation: total points not yet redeemed
Demographics: Breakdown by gender and age group
📌 Use it for: Health-check of your loyalty program performance.
👥 Members Tab
Track member behavior and audience insights:
Engagement Level: % of active vs inactive members
Origin of Membership: Where they signed up (Web Portal, Landing Page, In-Store)
Frequency of Engagement: Daily, weekly, monthly, rarely
Audience Breakdown: By gender and age
📌 Use it for: Segmenting members and evaluating channel effectiveness.
🤝 Referral Tab
Monitor referral performance:
Total Referrers & Referees
Points Issued to both parties
Referral Trend: Visual chart (daily/monthly)
Top 5 Referrers
📌 Use it for: Identifying your best brand advocates and adjusting rewards.
🎯 Offers Tab
Evaluate how well your offers are performing:
Points Issued Through Offers over time
Most Popular Offers by usage
Offer Performance: Most and least used
📌 Use it for: Optimizing timing, targeting, and types of offers.
🎁 Rewards Tab
Assess reward engagement:
Points Redeemed
Average Redemption Rate (per member and per redemption)
Most Popular Rewards
Reward Types Breakdown: Discount, free product, gift card, etc.
Performance: Most/least redeemed
📌 Use it for: Curating rewards that actually drive engagement.
💠 Points Tab
Dive deeper into your loyalty point economy:
Total Points in Circulation
Average Points Earned per member and per transaction
Point Issuance Breakdown: Manual, purchase, offer, referral
Point Redemption Overview
📌 Use it for: Maintaining program balance and preventing point inflation.
📣 Marketing Campaigns Tab
Track performance of both email and SMS campaigns:
Total Campaigns Created
Engagement Metrics:
Click-through rate
Open rate
Engagement rate
Opt-out rate (email & SMS)
Best Performing Campaigns
Performance Over Time: Filter by custom date range
📌 Use it for: Evaluating what messaging works and improving future campaigns.
📆 Date Filtering
Every tab includes a “Sort Data by Date” section at the bottom. You can:
Filter by Last Week, Last Month, or Custom Range
View trends and metrics over specific time periods
🧠 Pro Tips
Click "Refresh Now" in the top-right corner to load the latest data.
Use Top 5 Referrers and Most Popular Rewards/Offers to highlight and promote.
Combine dashboard insights with Lifecycle Stages and Tiers for high-impact campaigns.